From a programmer's perspective, a function is a unit of computational abstraction within a program. A function carries out some self-contained task, such as performing a numerical computation or displaying something in a page. In order to carry out the computation, however, the user does not need to know the details of how the function works. Those details are abstracted away, and the user only needs to know how to call the function. In this lab, you will work within a simple graphics environment, making function calls to control drawings on the screen.
In 1967, Seymour Papert and other researchers at MIT developed the programming language LOGO. LOGO was specifically designed to teach children how to program and solve problems on the computer. Central to the LOGO approach is the use of "turtle graphics", where the child/programmer draws pictures by moving an object (called a turtle) around on the screen. Simple commands such as "move forward 100 steps" and "turn right 90 degrees" are used to control the turtle, which leaves a trail (i.e., a line) in its wake.
The Web page Turtle.html contains a simple Turtle Graphics environment. In the top half of the page there is a box in which commands can be entered for controlling the movement of the turtle. When the button to the right is clicked, these commands are then executed and the turtle moves accordingly in the graphics screen below. The graphics screen is 400 units wide and 250 units tall, where each unit is a single pixel (dot) on the screen. The center of the screen is considered to be coordinate (0,0), so the x-axis (horizontal) ranges from -200 to 200 while the y-axis (vertical) ranges from -125 to 125. When you first load the page, the turtle is located at the center of the screen (0,0) facing straight up. You can't see the turtle itself, but you can follow its trail as it moves around on the screen. The coordinates of the turtle, along with its current heading (0 = up, 90 = right, 180 = down, etc.) and distance from the origin, are also displayed to the right. Functions for controlling the turtle's movement include:
forward: moves the turtle the specified number of steps in the direction it is currently facing. For example, forward(20) moves 20 steps forward.
left: turns the turtle the specified number of degrees to the left, relative to the current heading. For example, left(90) makes a right angle turn to the left.
right: turns the turtle the specified number of degrees to the right, relative to the current heading. For example, right(90) makes a right angle turn to the right.
Each time the "Execute code" button is clicked, the turtle will move according to the function calls in the large box at the top of the page. By default, each new drawing will begin where the previous one ended, although you can force all drawings to start at the center by checking the box labeled "Start each drawing at (0,0)". The lines drawn by the turtle will persist between executions, until the "Reset graphics screen" button is clicked.
EXERCISE 1: Describe what is drawn by executing each of the following sequences of function calls. Be sure to reset the graphics screen between each sequence by clicking the button labeled "Reset graphics screen".right(135); forward(40); left(90); forward(40); ________________________ forward(80); right(90); forward(40); right(90); forward(20); right(90); forward(40); ________________________ left(45); forward(100); right(180); forward(50); right(90); forward(50); left(180); forward(100); ________________________ forward(50); right(120); forward(50); right(120); forward(50); right(120);
You may have noticed that the last sequence of function calls is repetitive. In particular, it consists of the same two function calls repeated three times:
For repetitive drawing tasks such as this, the Turtle Graphics page provides a simpler mechanism for execution. To the right of the "Execute code" button is a box that specifies the number of times the code is to be executed. By entering the above two function calls and specifying 3 repetitions in this box, the same effect as before is obtained. That is, the two function calls are executed three times in succession.
EXERCISE 2: Execute the following sequence of function calls 3 times, and verify that it yields the same result as in the previous exercise.forward(50); right(120); Execute the following sequence of function calls 4 times and describe the results:
forward(50); right(90); Execute the following sequence of function calls 5 times and describe the results:
forward(80); left(144); Execute the following sequence of function calls 6 times and describe the results:
forward(20); right(90); forward(20); left(90);
EXERCISE 3: As you verified above, the function callsforward(50); right(120); when executed 3 times in succession, draw a triangle on the screen. Likewise, the function calls
forward(50); right(90); when executed 4 times in succession, draw a square. Simply by changing the turning angle and the number of executions, other regular polygons can likewise be drawn. For example, changing the angle to 72 and executing 5 times results in a pentagon. In general, what must the turning angle be in order to draw an N-sided polygon? Give your answer as a formula involving arbitrary variable N, such that if you assign N=3 and execute 3 times, a triangle is drawn; assigning N=4 and executing 4 times draws a square, etc. Verify your answer in the page.
In 1828, a biologist Robert Brown used a microscope to discover that small pollen grains in a drop of water seemed to quiver in perpetual motion. Brown showed that this motion was not biological but physical and the phenomenon became known as Brownian motion in his honor. In 1905, the 25 year old Albert Einstein wrote a brilliant paper that developed a theory of Brownian motion, explaining quantitatively how the perpetual motion was a natural consequence of many ongoing collisions of tiny invisible atoms with the pollen grain. This paper created much excitement since it provided, for the first time, an experimental way to prove the existence of atoms, which was a very controversial issue at the turn of the century. In 1926, a French experimental scientist, Jean Perrin, won the Nobel prize in Physics for verifying Einstein's predictions and for making the first quantitative measurements of Brownian motion.
One simplified model of Brownian motion involves a particle that takes successive steps of a fixed size but in randomly chosen directions. This approximates the effects of collisions of a big object with many small atoms. The path taken by such a particle is often referred to as a "random walk." It is possible to simulate such random walks using our Turtle Graphics environment. In addition to calls to turtle functions such as forward and right, the command box in the Turtle Graphics page can include arbitrary JavaScript code. In particular, it can contain assignments to variables and calls to JavaScript functions, such as Math.random and Math.floor. It can even utilize functions from the CSC121 random.js library, such as RandomInt and RandomOneOf. Thus, the following code for simulating a random walk can be executed in the Turtle Graphics page:
EXERCISE 4: Enter this code into the Turtle Graphics page and set the number of repetitions to be 200. Execute the code at least 10 times, resetting the screen between each walk. Do walks ever extend beyond the boundaries of the graphics screen? Do walks ever extend off the screen but then later return? Describe the patterns you see.
Since random walks are, by definition, random in nature, you might think that there is no way to predict the result of a random walk. Statistically speaking, this is not true. Think back to the random darts and needles from Lab 2. Despite the fact that each dart thrown or needle dropped was random, the distribution of a large number of them was predictable, allowing us to determine approximations of π. This same sort of predictability holds for random walks. While it is possible for a walker to head off in one direction and continue in a straight line, this is very unlikely. More often, the path taken will loop back upon itself and the walker will not venture too far off from its starting point. In fact, it has been proven that after N random steps, the expected distance of the walker is sqrt(N) steps from its starting place. Or, perhaps a better way to say it is that the square of the final distance will be equal on average to the number of steps taken.
EXERCISE 5: Set the step size to 1 and the number of repetitions to 100. Then, conduct 10 random walks by clicking the "Execute code" button repeatedly. Be sure to check the box labeled "Start each drawing at (0,0)" to ensure that each random walk begins at the center of the screen. Record the squares of the 10 final distances. What is the average of those 10 distances? Is it close to the expected value of 100?
Since 10 random walks are not very many, your average from the last exercise may not have been very close to the expected value. The page Walk.html makes it easier for you to conduct a large number of random walks and gather statistics on those walks. You can enter the number of desired random walks and details for each walk (the number of steps, the step size, and the turning angle). To save time, only the final position of the turtle is marked for each walk, and averages over all of the walks are displayed.
EXERCISE 6: Using the Walk.html page, conduct 1,000 random walks, each consisting of 100 steps. What is the average step distance2 of your 1,000 walks? Is it close to the expected value of 100? Note: you can change the step size for the walks without affecting the average, since the box labeled average (step distance)2 normalizes the distance with respect to the step size.
EXERCISE 7: Now, conduct 10,000 random walks, each consisting of 100 steps. What is the average (step distance)2 of your 10,000 walks? Is this number closer to the expected value than the average over 1,000 walks?
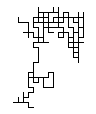
With each step, a random walk chooses one of 360 directions in which to take a step. Sometimes, a walk is more constrained. Imagine walking in a city such as Manhattan, where each block constitutes a step. Since most streets meet at right angles, you generally have four choices in direction (including turning around) at each corner. Because of this analogy, a random walk where the direction is constrained to right angles only is known as a Manhattan walk (see example below).
EXERCISE 8: In the Turtle.html page, modify your random walk code to simulate a Manhattan walk. That is, change the formula in the assignment toturnAngleso that it randomly chooses between four directions (90, 180, 270 or 360 degrees) for each step. Verify that your modification produces the block effect as shown above, then list your modified statement(s). Hint: to select among the four turn angles, you could utilize theRandomOneOffunction, or you could useRandomIntto generate a random integer in the range 1 to 4, then multiply that number by 90.
EXERCISE 9: How would you expect Manhattan walks to compare with unconstrained 360-degree random walks? That is, would you predict that the expected distance for a Manhattan walk would be greater or smaller than the corresponding unconstrained random walk with the same number of steps and step size? State a hypothesis and a possible rationale for that hypothesis.
EXERCISE 10: Using the Walk.html page, test your hypothesis from EXERCISE 9. That is, modify the formula in the "Expression for each turn" box to match your modification from EXERCISE 8 and conduct 10,000 Manhattan walks (of 100 steps each). Compare the average (step distance)2 with that obtained in EXERCISE 7. Do the results support or contradict your hypothesis? Is there enough of a difference to be considered significant? If necessary, conduct further experiments until the data obtained is sufficient to draw a conclusion. Report your results and how they justify your conclusion.
Submit a file containing your answers via Blueline.