CSC 221: Introduction to Programming
Fall 2018
HW 3: Python Functions
This assignment will involve writing several Python functions. You should save all of your functions in a single Python module named lastnameFuncs (where lastname is your last name). The module should have a comment block at the top, containing the file name, your name, the date, and a brief description. Each function should also have a doc string that describes its behavior.
Note: this work must be entirely your own, with no outside assistance other than the instructor.
Part 1: Repackaged Time
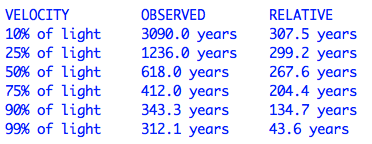
For the first part of this assignment, you will rewrite your relative time code from HW2 in function form. In particular, you will repackage your code into the following functions:
Part 2: Volleyball Simulations
In honor of the Creighton Volleyball team being in the top 10, you will develop a series of Python functions for simulating volleyball games and collecting statistics on competitive balance. These functions will have many similarities to the Pig simulation functions we wrote in class (see
control.pytxt for the code).
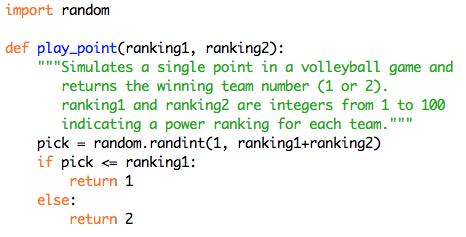
Assume that the two teams in a volleyball game are each given a power ranking: an integer between 1 and 100. The higher the power ranking, the more likely that team is to win a particular point. For example, if team 1 and team 2 have identical power rankings, say 60 and 60, each is equally likely to win a given point. However, if team 1 has a power ranking of 80 and team 2 has a power ranking of 40, then team 1 is twice as likely to win a given point. The following Python function can be used to simulate a single point in a volleyball game.
- Define a Python function named play_game that simulates a complete game of volleyball by calling play_point repeatedly. The function has three inputs, the number of points required to win a game, the power ranking of team 1, and the power ranking of team2. It should print the score after each point. For example:
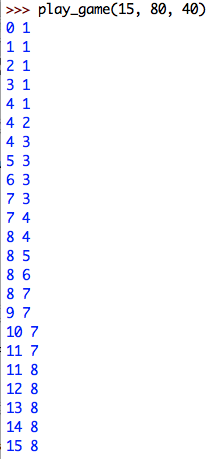
Note that a team has to win a game by at least two points. You will need to think carefully how to address this in your function.
- Once you have your play_game function working correctly, comment out the print statement by placing a '#' character at the front of the line. Instead, have the function return a pair of values: the final score of team 1 followed by the final score of team 2 (in parentheses, separated by a comma). For example,
return (score1, score2)
The components of the return pair can be accessed individually using a variant of an assignment statement:
(score1, score2) = play_game(25, 85, 70)
- Define a second function named play_stats that performs repeated game simulations and keeps track of the winning percentages of the teams. The function should have four inputs, the number of games to be played, the number of points required to win a game, and the power rankings of the two teams. It should then repeatedly call the play_game function and keep track of the number of wins by each team. At the end, it should print a message of the form "Team 1 won X % of the games.", where X is the winning percentage of team 1 (rounded to one digit to the right of the decimal place).
- In our model, the power rankings provide a way of predicting which team will win a given point. A team with a 50% advantage in power rankings (e.g., 60 vs. 40) is 50% more likely to win a given point. However, this relative advantage may not hold the same over the course of an entire game. You are to conduct several experiments with different power rankings to determine how a relative advantage in points translates to a relative advantage in games.
For each simulation, assume 10,000 games are to be played, with each requiring 25 points to win.
| team1/team2 rankings
| expected % of points
won by team 1
| actual % of games
won by team 1
|
|---|
| 50/50 | 50.0% |
|
| 55/45 | 55.0% |
|
| 75/50 | 60.0% |
|
| 80/40 | 66.7% |
|
| 60/20 | 75.0% |
|
| 80/20 | 80.0% |
|
| 90/10 | 90.0% |
|
In a separate document, list your generated statistics and describe the trend you see in the overall game winning percentages. Do they tend to match the point percentages fairly closely? If not, why do you think they differ? Is the effect consistent as the relative difference in point percentages increases?
- If a college volleyball match goes to a fifth set, that set is played to 15 instead of 25 (presumably to avoid injuries due to fatigue). However, shortening the game can also affect competitive balance. Repeat your experiments, only with shorter games. For each simulation, assume 10,000 games are to be played, with each requiring 15 points to win.
| team1/team2 rankings
| expected % of points
won by team 1
| actual % of games
won by team 1
|
|---|
| 50/50 | 50.0% |
|
| 55/45 | 55.0% |
|
| 75/50 | 60.0% |
|
| 80/40 | 66.7% |
|
| 60/20 | 75.0% |
|
| 80/20 | 80.0% |
|
| 90/10 | 90.0% |
|
List your generated statistics and describe the trend you see in the overall game winning percentages. Do they tend to match the game percentages from 25 point games fairly closely? If not, why do you think they differ? Is the effect consistent as the relative difference in point percentages increases?